How to run mimicINT
Upload your sequences
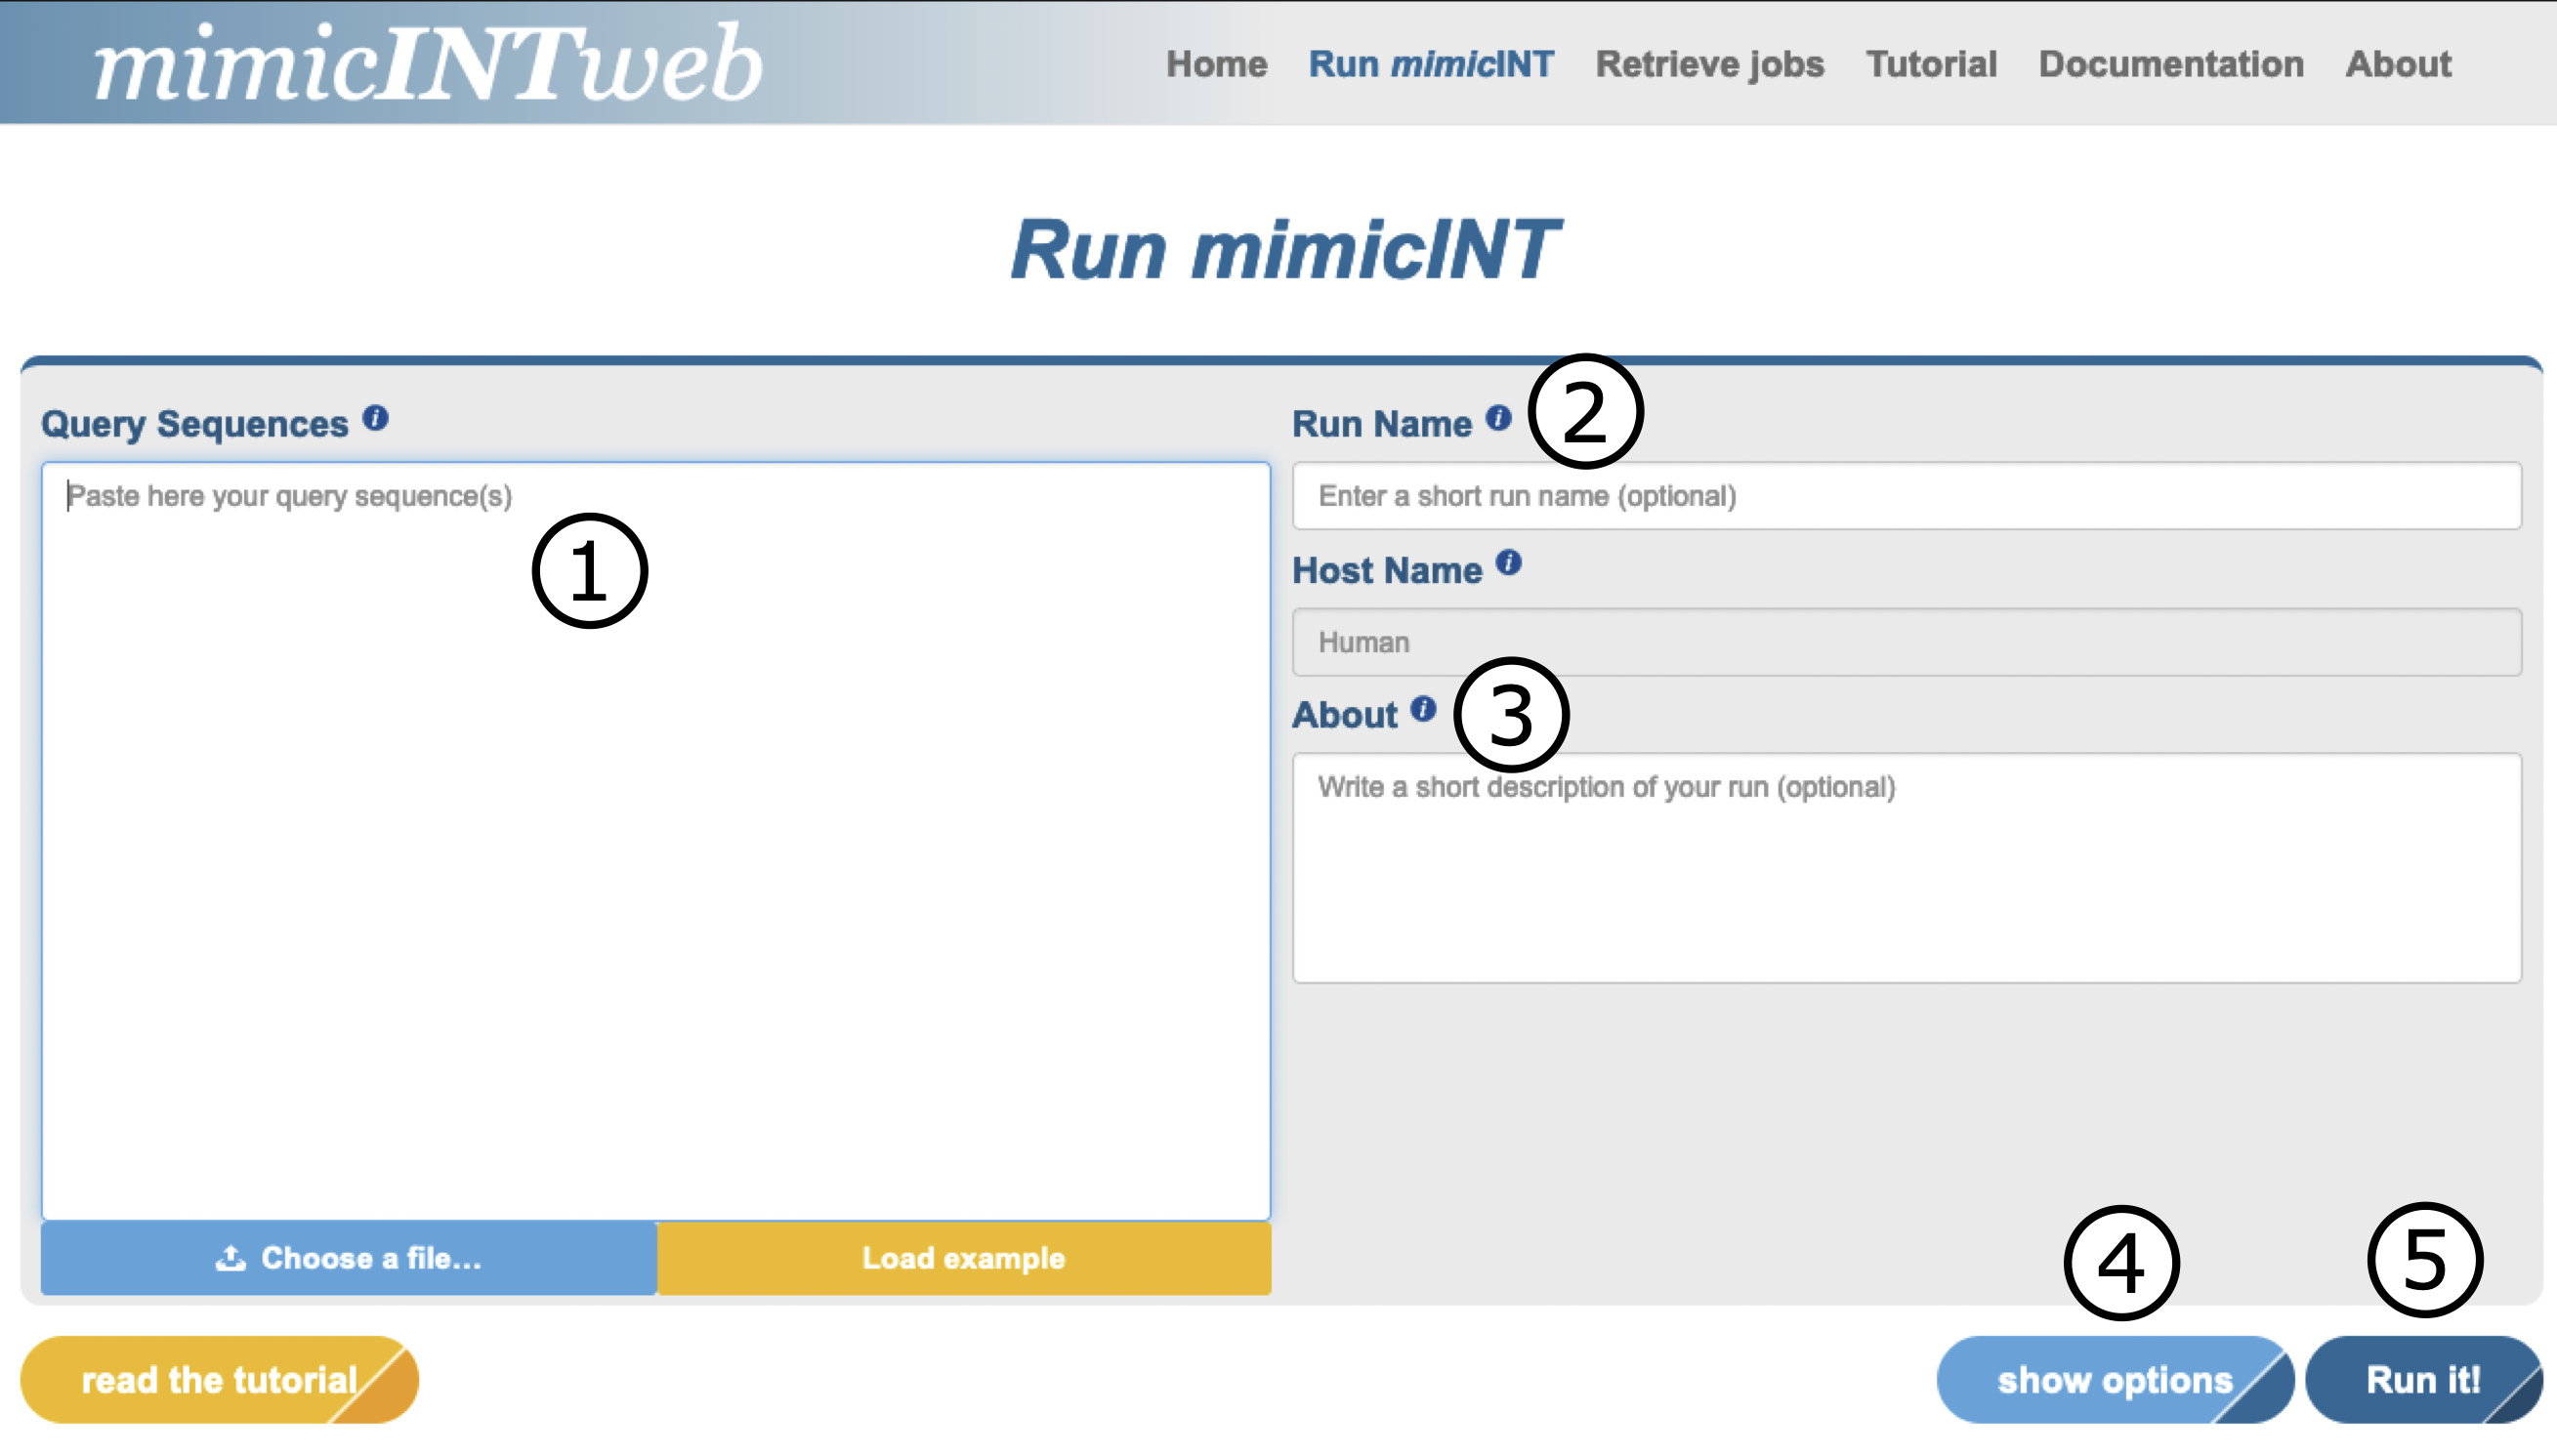
The user can submit up to 50 proteins sequences (1). Moreover, the user can also choose a run name (2) and provide a short description (3). This can be useful if the user plans to run multiple mimicINT inference tasks. By clicking on the show options button (4), the user can tune the running parameters or run mimicINT with the default ones (5).

Choice of the parameters
The parameters that the user can tune are the following:
The IUPred disorder prediction modality (either short or long) (1)
The disorder propensity score (default = 0.4) (2)
The minimum size of the disorder region in which short linear motifs should be identified (default = 10) (3)
The E-value threshold for domain detection in the user sequences (default = 10-5) (4).
The host protein domain score threshold (default = 0.3) (5). You can find more details on the domain score in the documentation page.
The user can reset the parameters to default anytime (6), hide the options (7) and/or run mimicINT (8).

mimicINT job handling
mimicINTweb assigns to each run a unique identifier. Based on the number of submitted sequences, a run can last between 3 and 15 minutes. User jobs are managed by the SLURM workload manager.

Result summary and sequence features
mimicINTweb provides a summary of the results, that is the number of interacting host proteins and the number of inferred interactions (1). It also provides some statistics on the user proteins sequence features, such as their length and their disorder content, defined as the fraction of amino acids with a disorder propensity above the user-defined threshold (2).

Searching the sequences feature table
For each user protein, it provides also a table lists of domains and SLiMs detected along with their relative position. The user can search and filter the content of the table (1).

Inferred interactions (full set)
By clicking on the inferred interactions (full) button, the whole list of inferred interactions is displayed in a tabular format. For each interaction, the table lists the identifier of the user sequence, the identifier of detected domain (InterPro) or SLiM (ELM), the host protein identifier (UniprotKB), the host cognate domain (InterPro) as well as the interaction template type (domain-domain or motif-domain). Identifiers (besides the user-provided ones) are clickable and allow to visualize their description. The user can search, sort and filter the content of the table.

Inferred interactions (filtered)
By clicking on the inferred interactions (filtered) button, provide the whole list of inferred domain-domain interactions and the inferred motif-domain interactions that fulfil the domain score threshold set by the user. The table content is the same as the inferred interactions (full) page. Identifiers (besides the user-provided ones) are clickable and allow to visualize their description. The user can search, sort and filter the content of the table.

Functional enrichment
The user can visualize the results of a functional enrichment analysis generated using the gprofiler2 R client. The annotations that are tested are: Gene Ontology (all branches), Reactome and KEGG pathways. Only enriched annotations with an adjusted p-value < 0.05 are listed. For each enriched annotation, the following details are provided: identifier, annotation source, annotation term name, adjusted p-value, number of annotated host protein with the given term in the statistical background, number of query proteins, number of query proteins annotated with the given term.

The user can search, sort and filter the content of the table.

Download files
The user can download all the output files related to the run in a ZIP archive for further down-stream analyses

Retrieve a user job
The user can paste a job identifier to retrieve the corresponding results, which are removed on a regular basis.
